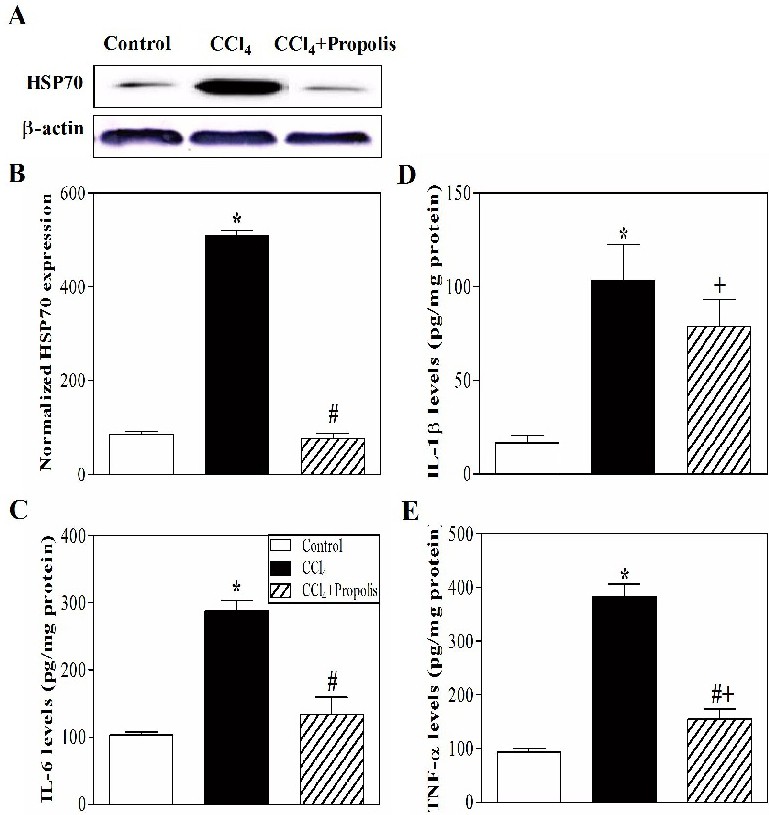
Fig. 3. Effects of CCl4 and propolis on the proinflammatory markers in liver tissues. The expression of HSP70 was detected in the liver lysates using Western blot analysis. The protein bands from one representative experiment are shown (A). β-actin was used as a loading control. The expression of HSP70 was normalized to total β-actin protein levels. The results are expressed as the means ± SEM of the normalized values of HSP70. The accumulated data of five mice from each group are shown in (B) for the expression of normalized HSP70 from control mice (open bars), CCl4-treated mice (closed black bars), and CCl4+propolis-treated mice (hatched bars). The levels of the proinflammatory cytokines IL-6 (C), IL-1β (D) and TNF-α (E) were measured in three groups of mice using ELISA. The results are presented as cytokine levels (pg) per mg of liver lysate in control (open bars), CCl4-treated (closed black bars), and CCl4+propolis-treated (hatched bars) animals. Data are expressed as the mean ± SEM (n = 5). *P<0.05 for CCl4-treated mice versus control mice. #P<0.05 for CCl4+propolis-treated mice versus CCl4-treated mice. +P<0.05 for CCl4+propolis-treated mice versus control mice (ANOVA with Tukey's post-test).